APF
-
Posts
867 -
Joined
-
Last visited
-
Days Won
22
Content Type
Profiles
Forums
Events
Everything posted by APF
-
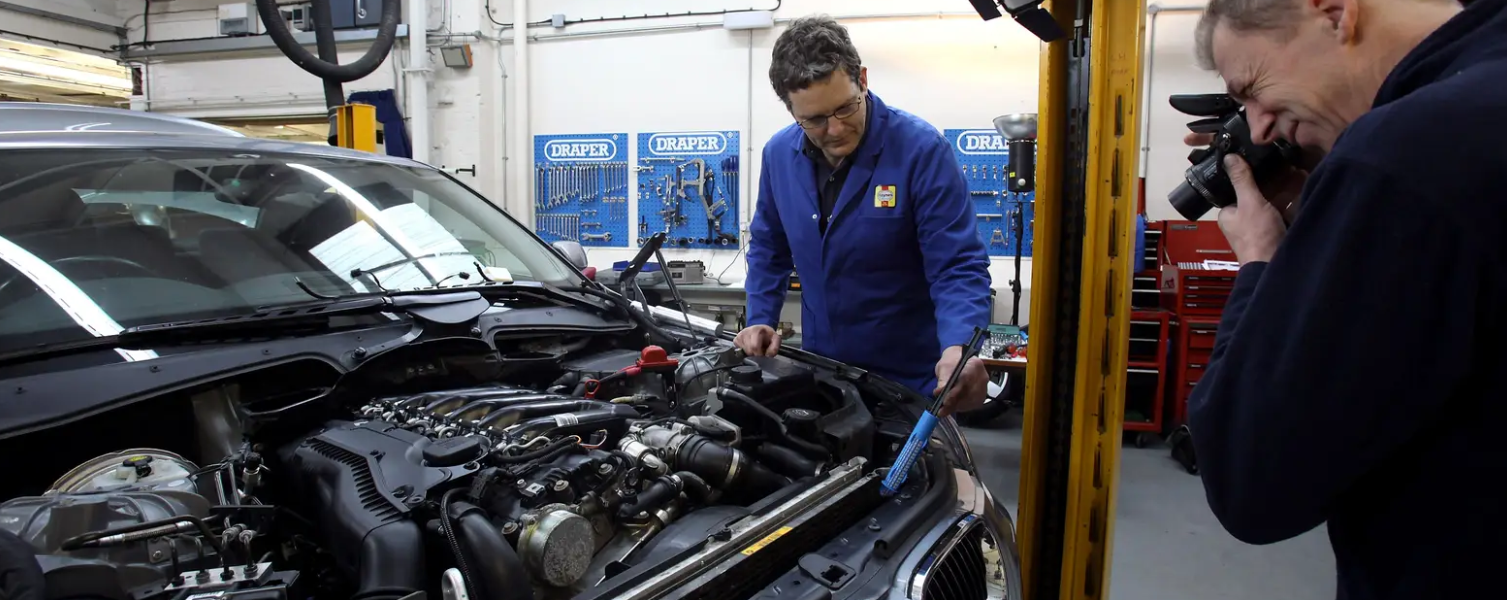
 There are certain items on a car that can easily be replaced without taking the car to a garage to be fixed. This is great for a handful of reasons. First, you can avoid unwanted bills and keep the money for something else. Secondly, keeping your car running efficiently all by yourself is very satisfying. Some jobs are too large and require the eye of a qualified, professional mechanic, but there are other basic jobs that take minimal time and only a little know-how and can be done at home with a few basic tools. Here are some easy ways to look after your car without the help of a mechanic, to ensure it stays on the road for as long as possible. Windshield-wiper blades After a while, windshield-wiper blades can start to leave smear marks on the window, as the rubber strips that push rainwater away can degrade. Often this leads to squeaking noises and the rain or snow is not cleared effectively, causing buildup and distorting forward vision. Windshield wipers are a simple, off-the-shelf part. They only cost $20 to $40 and can be purchased online for your exact automobile make and model. You can simply unclip the old windshield wipers and clip the new ones on. The same can be done for the rear window-wiper blades too, if your car has them. Mechanics may charge an additional $30-$100 in labor fees to replace them. Oil change Oil changes should be made on a regular basis. Manufacturers recommend changing the oil of your car every 7,500 to 10,000 miles as an approximation. Each car is slightly different, so check the guide for your specific car model. The average price for a bottle of oil is $25-50, with synthetic engine oil averaging $45 to $70. Here's a straightforward guide on how to perform an oil change. It's a really easy job to complete on a driveway or home garage with only a few tools. Oil filter Since the oil filter is usually accessed from inside the oil tank, it is great practice to change the oil filter at the same time you change your oil.. The job of the oil filter is to ensure contaminants don't accumulate in the engine oil, which can cause internal damage to the engine surfaces. Through the oil filter, unwanted particles are removed from the oil tank before circulating and lubricating the engine. Changing the oil filter as regularly as changing your oil ensures the engine will operate optimally. Air filter The air filter is a simple, inexpensive part to change and forms an important role in the car engine. The air filter prevents dust, dirt and debris getting into the engine via the air intake, ensuring only clean, filtered air passes through. This part should be changed at certain intervals, usually between 15,000 and 30,000 miles, depending on where your car is driven. Lift up the hood, and there is a rectangular cold air collector box. Inside is the spongy, foam material. Swap it out for a new one. It takes 10 minutes, tops. Headlight and taillight bulbs On older cars that don't have LED lights, headlight and taillight bulbs can easily be replaced by hand in very little time for minimal cost. The cost of new bulbs is a couple of dollars and avoids having to take your car into the garage. Bulbs often stop working over time and it is a legal requirement that the correct lights are visible on a car. They can be bought for a couple of dollars from an auto-repair store or online. To access the housing of the lights, open the hood to get to the headlights or the trunk for the rear taillights. This will allow you to find the housing and switch out the faulty bulb with the new, working ones. On some vehicles, you may need to remove additional parts (and in some cases, the entire bumper) in order to have an unimpeded view of the headlight or taillight housings. Spark plugs Changing the spark plugs will save you around $100 in labor costs and should be done every 30,000 miles. The spark plugs will only cost you $16 to $100, depending on how many you have to change. For a four-cylinder engine, you will have four spark plugs to replace, for a V6 engine; you will have six, and so on. Battery Similar to phones and laptops, car batteries degrade over time. Most car batteries last between two and five years, depending on the condition. It is recommended to change your car battery after three years. A car battery that is five years or older won't function properly and may start to cause problems in the future. The average price of a new battery is between $50 and $200 and is a straightforward plug-and-play swap with the old one. Brake pads Over time, the brake pads become worn down through regular use and require replacing to ensure your car continues to stop safely and effectively when you want it to. There should be a minimum of 6.4 millimeters of brake pad remaining as a general rule of thumb. The brake pads are accessed by removing the wheels from the car and are straightforward to replace. You can see instructions on how to change brake pads here. Changing brake pads requires a bit more work than the previously mentioned parts but are well worth doing yourself. A set of four brake pads only start at around $30 to $50 for budget vehicles and can cost a few hundred dollars for premium cars and sports cars. Brake discs The brake discs can be changed at home, too. It's another straightforward part and is usually completed in pairs, because properly functioning front brakes will wear evenly on the left and right and the rear brakes will do the same on the left and right. Depending on your vehicle, the front brakes and rear brakes will wear down at a varying rates. Roughly $100 to $500 is the average cost for a pair of brakes, depending on the make and model of your vehicle. Being able to switch them out yourself will save you a lot of money over the lifetime of a car, removing some associated labor costs. Source: https://www.businessinsider.com/car-parts-you-can-replace-yourself-instead-of-hiring-mechanic-2019-10#brake-discs-9
-
TOKYO - Hitachi Ltd and Honda Motor Co said Wednesday they will merge four auto parts suppliers under a new company to boost competitiveness amid a multitude of challenges and opportunities created by the emergence of autonomous and electric vehicles. The plan is in response to the intensifying race to develop next-generation technologies for so-called CASE -- connectivity, automation, sharing and electrification -- applications. The merger involves Hitachi Automotive Systems Ltd, a wholly owned subsidiary of the electronics giant, as well as Keihin Corp, Showa Corp and Nissin Kogyo Co, which are under Honda's wing. The combined sales of the four firms would be around 1.8 trillion yen ($16.5 billion), making the merged company one of the leading auto parts manufacturers in Japan. "The auto parts maker business is changing," Hitachi Vice President Keiji Kojima said at a joint press conference in Tokyo. He said the merger would lead to the development of competitive technologies and solutions while taking advantage of the new company's economies of scale in providing its products globally to customers. "We can lead the auto industry, especially in the field of automation and electrification," Honda Managing Officer Noriya Kaihara said. In the deal, Hitachi Automotive Systems will absorb Honda's three subsidiaries after the automaker obtains all stocks in the three suppliers through takeover bids. The name of the new company is yet to be decided. Hitachi will hold a 66.6 percent stake in the merged company, and the rest will be owned by Honda after finishing their merger procedures in about one year, they said. Hitachi has been streamlining its automotive business to enhance profitability, selling car navigation system maker unit Clarion Co to French car parts maker Faurecia S.A. in March. Hitachi Automotive Systems, the largest company among the four firms by sales, said in June it aims to expand its annual sales of automotive parts and related products to between 1.2 trillion and 1.7 trillion yen by the business year ending March 2022 from 971 million yen in the year ended March 2019. The main products made by Honda's Keihin include fuel management and electric motor control units, while Showa makes steering and shock absorber parts among others. Nissin Kogyo is a supplier of brake parts. Source: https://japantoday.com/category/business/update1-hitachi-honda-to-merge-4-auto-parts-makers-to-boost-competitiveness
-
Chrysler USA and Europe part number differences
APF replied to Vitaly Oleg's topic in Help Finding The Right Auto Parts
What part number(s) are you having issues with identifying? Topic title shortened. -
Updated coupons from their website.
-
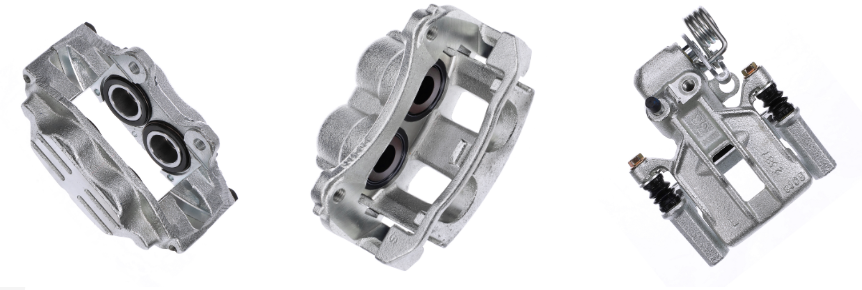
LOS ANGELES, Aug. 06, 2019 (GLOBE NEWSWIRE) — Motorcar Parts of America, Inc.(Nasdaq:MPAA) today announced the strategic expansion of its automotive aftermarket brake product offerings, with the introduction of brake calipers. “The launch of a brake caliper program complements our current braking system products and is consistent with our strategy to leverage our expanding manufacturing footprint by approximately 370,000 square feet in Tijuana, Mexico — supported by the company’s new state-of-the-art 410,000 square foot distribution facility. We have significant initial customer commitments representing approximately $30 million for the remainder of the current fiscal year. We are attracting additional strong interest for this product, and look forward to fully ramping up production, growing this category, and reporting milestones as fiscal 2020 evolves,” said Selwyn Joffe, chairman, president and chief executive officer of Motorcar Parts of America, Inc. “This category represents a significant growth opportunity, leveraging our more than fifty-year history in the aftermarket industry and the company’s highly regarded competency in remanufacturing. Equally important, the launch of this product line solidifies our position as a full-line brake supplier, which provides the company with solid growth opportunities and favorable financial metrics,” Joffe emphasized. “We have made significant investments to support our initiatives to become a leading multi-product line supplier and this launch further strengthens our position,” Joffe added. Industry sources estimate the aftermarket size today for the brake caliper category in the United States is approximately $1.1 billion at the retail level. About Motorcar Parts of America Motorcar Parts of America, Inc. is a remanufacturer, manufacturer and distributor of automotive aftermarket parts — including alternators, starters, wheel bearing and hub assemblies, brake calipers, brake master cylinders, brake power boosters, rotors, brake pads and turbochargers utilized in imported and domestic passenger vehicles, light trucks and heavy-duty applications. Motorcar Parts of America’s products are sold to automotive retail outlets and the professional repair market throughout the United States and Canada, with facilities located in California, Mexico, Malaysia, China and India, and administrative offices located in California, Tennessee, Mexico, Singapore, Malaysia and Canada. In addition, the company develops, designs and manufactures testing solutions for performance, endurance and production testing of alternators, starters, electric motors, batteries, inverters and belt starter generators for both the OE and aftermarket. Additional information is available at www.motorcarparts.com. Forward-Looking Statements The Private Securities Litigation Reform Act of 1995 provides a “safe harbor” for certain forward-looking statements. The statements contained in this press release that are not historical facts are forward-looking statements based on the company’s current expectations and beliefs concerning future developments and their potential effects on the company. These forward-looking statements involve significant risks and uncertainties (some of which are beyond the control of the company) and are subject to change based upon various factors. Reference is also made to the Risk Factors set forth in the company’s Form 10-K Annual Report filed with the Securities and Exchange Commission (SEC) in June 2019 and in its Forms 10-Q filed with the SEC for additional risks and uncertainties facing the company. The company undertakes no obligation to publicly update or revise any forward-looking statements, whether as the result of new information, future events or otherwise. CONTACT: Gary S. Maier (310) 471-1288 Source: Motorcar Parts of America, Inc. http://www.motorcarparts.com/news/motorcar-parts-of-america-launches-brake-caliper-product-line/
-
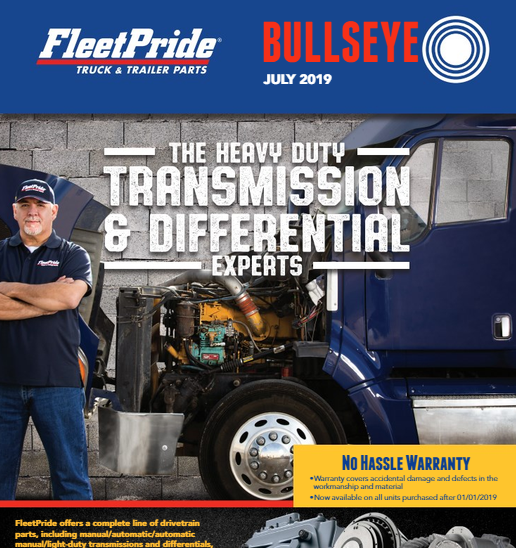
Check out FleetPride's online Bullseye deals catalog: https://fleetpride.com/deals
-
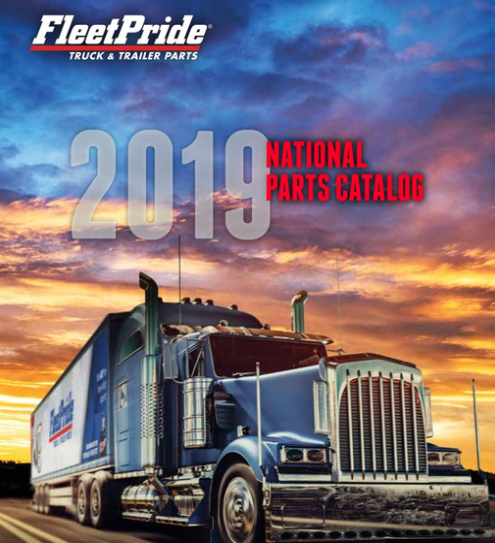
Check out FleetPride's national catalog online: https://fleetpride.com/catalogs
-
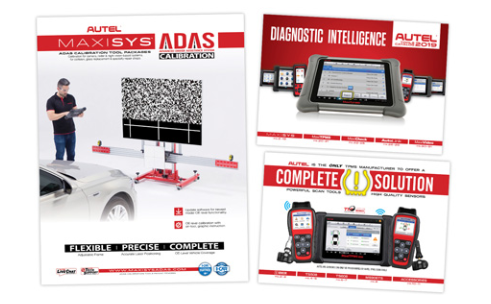
Autel has released digital versions of its product catalogs. The full tool catalog, TPMS catalog and ADAS-focused 12-page brochure now can be viewed on a PC, tablet or smartphone. Files of the catalogs can be shared and downloaded to facilitate communication between sales reps and customers about Autel products. The full tool catalog features the latest Autel product lines. ADAS, MaxiSYS, TPMS, MaxiCHECK, MaxiDIAG, AutoLINK and MaxiVIDEO tools all get the spotlight on their respective spreads. Featured software and hardware specs are highlighted, serving as a valuable overview of what Autel is all about. The TPMS catalog has a split focus on the Autel TPMS service tools as well tire sensors and other TPMS accessories. Autel’s newest items, the TS508WF and adjustable angle 1-Sensor, make their print debut, along with new 8, 20 and 240 1-Sensor bulk packs. “The TPMS catalog is a must-have reference for any Autel carrying-shop,” the company said. The ADAS brochure is an in-depth look into Autel’s ADAS calibration packages. With the brochure, customers can learn the benefits of performing ADAS in-house and find the best package for their shop and budget. Source: https://www.counterman.com/autel-releases-digital-versions-of-its-product-catalogs/
-
Fisher Auto Parts has acquired Burlington Foreign Car Parts (BFCP), it was announced today by Herb Godschalk, co-president of Fisher Auto Parts. BFCP operates nine locations, including six in Vermont, two in New Hampshire and one in New York. Adam Glaser will stay on following the acquisition and will continue to help grow the business. “We are thrilled to transition our family business to the very capable hands of the Fisher team and I am excited to continue working and helping to grow the business,” said Glaser. “On behalf of the Glaser family, including my parents Tom and Jill, I would like to extend our utmost thanks and appreciation for all the effort and dedication that the BFCP team has put in over the past 46 years. We also thank our very loyal customers and vendor partners for the roles they’ve had in our success.” Burlington Foreign Car Parts (BFCP) was founded by Tom Glaser in April 1973 with a van full of Volkswagen parts. Starting as a “mom-and-pop” operation, Tom made the deliveries and his wife Jill managed the bookkeeping. Son Adam joined the company and was integral in running the business for the past 20 years. In addition to BFCP, Fisher has added 19 other locations within the past year, comprising of 11 in Michigan, three in Vermont, and one each in Illinois, Kentucky, New Hampshire, Pennsylvania and Virginia. A member of the Automotive Parts Services Group/Federated Auto Parts, Fisher Auto Parts has approximately 500 company-owned locations and 100 independent jobbers in 18 states. Source: https://www.aftermarketnews.com/fisher-auto-parts-acquires-burlington-foreign-car-parts/
-
Parts Authority, one of the largest distributors of automotive and truck parts to the aftermarket auto parts industry throughout the U.S., has acquired Penny Pincher Auto Parts, expanding the Parts Authority market share in Arizona. The transaction closed May 1, 2019. Penny Pincher has built its reputation on providing the highest level of service combined with the most reliable inventory in Phoenix for more than 40 years. Under the Parts Authority umbrella, Penny Pincher will continue to operate with its existing management teams. “This is an incredible addition to our Parts Authority family of brands. Jeff and Juan have built a tremendous business over the years at Penny Pincher. The business model and team they have in place is a great addition to our overall platform,” said Eric Schwartz, vice president of West Coast operations of Parts Authority. “Juan and I are extremely excited to join the Parts Authority Family. Parts Authority has been a major force in the automotive and truck parts aftermarket for many years. We believe this partnership will allow us to be even more competitive in the Phoenix Metro marketplace, while also providing great benefits to our knowledgeable team members and our loyal customers. We’re ecstatic at what this partnership has to offer,” said Jeff Ungerman, owner of Penny Pincher. Source: https://www.aftermarketnews.com/parts-authority-acquires-penny-pincher-auto-parts/
-
Your topic has been approved but your links have been removed.
-
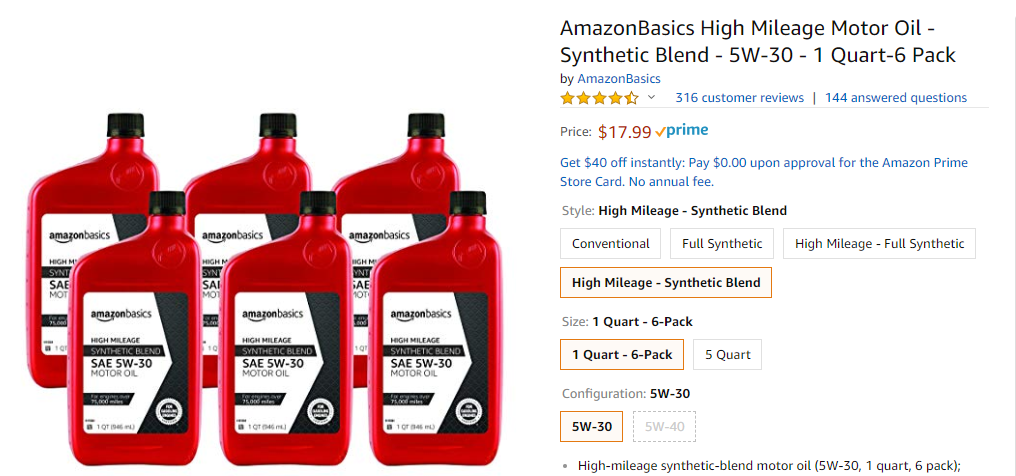
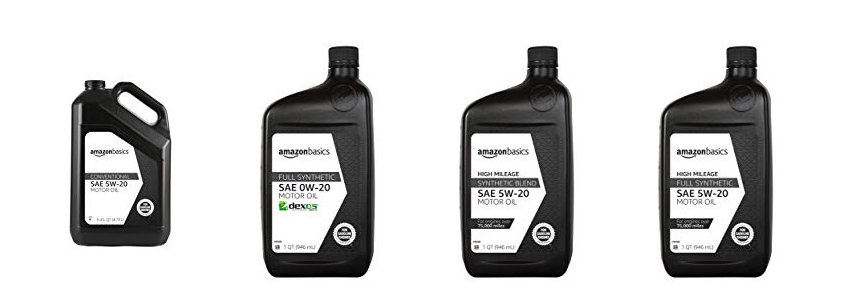
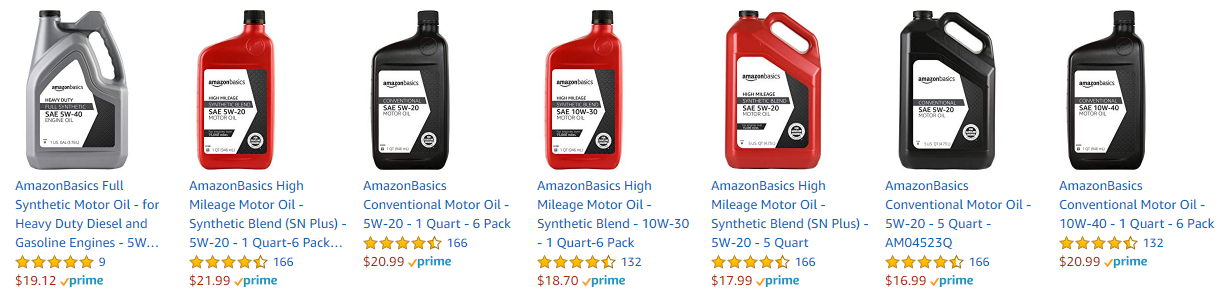
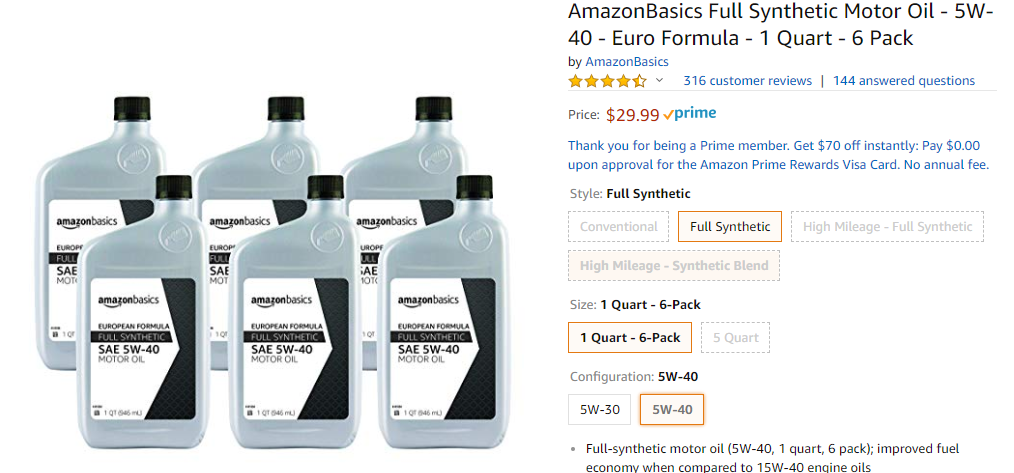
AmazonBasics High Mileage Motor Oil - Synthetic Blend AmazonBasics high-mileage synthetic-blend motor oil offers an enhanced level of protection for engines over 75,000 miles. Its synthetic blend combines conventional oil with synthetic for cost efficiency with some of the benefits of a full synthetic. An important part of routine maintenance, the motor oil works well for anything from topping off levels to complete oil changes. Whether it’s a beloved older vehicle or one with an uncertain maintenance history, help protect its engine with AmazonBasics high-mileage, synthetic-blend motor oil. API SN and ILSAC GF-5 approved, AmazonBasics high-mileage motor oil offers exceptional quality and convenience. Note: Always follow vehicle manual recommendations. Friction-Reducing Formula AmazonBasics high-mileage motor oil creates a protective coating that helps reduce wear on engine components. By minimizing friction from in-contact moving engine parts (which wastes otherwise useful power), the motor oil helps enhance fuel economy and promotes better power output and performance. Reliable Protection The high-mileage motor oil helps keep the engine clean by minimizing unwanted build-up that can cause damaging rust and corrosion. The motor oil offers a resistance to viscosity and thermal breakdown, plus it helps fight volatility burn-off, which can reduce engine deposits and exhaust emissions. Available Viscosity Grades The motor oil’s grade, as established by the Society of Automotive Engineers (SAE), reflects its viscosity characteristics. The first number(s)—5W and 10W—indicate cold-temperature performance (W for winter), while the end numbers—20, 30, and 40—indicate high-temperature performance (at 100 degrees C). Depending on driving conditions and needs, choose from the following AmazonBasics high-mileage synthetic-blend motor oil grades (shown in chart below; each sold separately):
-
he Car Care Council's new video takes the unknown out of auto parts stores. Entitled "Explore an Auto Parts Store," this video opens the door to the neighborhood part store for all vehicle owners. You do not have to be an expert to get involved with car care and these few minutes give the jump start needed to save time and money at home!
-
try http://showmethefilters.com/
-
In our 2019 Distribution Preview in the January issue of Counterman, aftermarket leaders reflect on the highlights and accomplishments of 2018, and discuss their plans, goals and expectations for the year ahead. Here’s our Q&A with Bob Cushing, executive vice president for Advance Professional: CM: What were some of the highlights for Advance Professional in 2018? BC: We rolled out a number of major initiatives in 2018. They were all about improving the customer experience through the introduction of new technology. One key initiative was enabling our entire network to have complete access to our industry-leading product assortment, which we refer to as “cross-banner availability.” We phased in the technology for cross-banner visibility first with our store systems and then through our B2B platforms, AdvancePro and speedDial. Our team members’ engagement in this project produced very positive responses from our customers and contributed to driving market-share gains. Secondly, we introduced MyAdvance, enabling our customers to have complete access to our professional programs and products from a single portal. MyAdvance consolidated more than 30 different portals and includes access to AdvancePro, our B2B platform, CTI training, eServices, product offers and other information they need to run their business. Customers also can check product availability, place orders and manage multiple aspects of their business through a single portal. At WORLDPAC, and now at Advance, I view our business as a tech company that sells automotive parts and provides technical solutions to our customers. In 2017, our digital-transformation roadmap was developed to support “The Right Part at the Right Time,” and in 2018, we began to deploy our new technology. We – and more importantly, our customers – are excited about what we’re doing at Advance. At Advance Professional, we’re doing everything to continue to build stronger and stronger partnerships with our customers. In our banner program, TECHNET, we’ve enhanced the program and membership across all of our brands. The industry’s leading training programs – the WORLDPAC Training Institute (WTI) and the Carquest Technical Institute (CTI) – are now integrated to provide our entire enterprise-wide customer base a broader curriculum of classes. The WTI/CTI training program empowers our customers to meet the complexity of repairing today’s vehicles. With an industry-wide shortage of certified technicians, WTI/CTI is training our customer’s technicians on new technology such as ADAS and helping build career paths to attract and retain technicians. In 2018, we held our biennial WORLDPAC Supplier & Training Expo [STX], with more than 1,500 attendees. We’re already building our new curriculum for the STX 2020 event, including more than 150 classes, and we’re expecting more than 2,000 attendees. STX 2020 will be the largest training and supplier expo event in the automotive industry. CM: What does Advance Professional have planned for 2019? BC: We’ll continue to focus on our digital roadmap, focused on providing our customers the ability to access our complete suite of products, services and data. Over the past few years, we’ve spent a lot of time developing Virtual Vehicle, a cloud-based library of 3-D animations illustrating how each vehicle part and system works. Virtual Vehicle identifies what repair is needed when certain vehicle conditions exist. This enables our customer’s service advisers to explain, in simple terms, the repair work required to the car owner. What we’ve found in shops that use this tool is an increase in repeat business, more referrals and higher conversion rates. We’re relaunching Virtual Vehicle with an expanded assortment of new videos, including how to replace parts on specific vehicle models. We’re building further enhancements and benefits to our TECHNET banner program to improve the customer experience and drive new membership. We all know about the importance of access to vehicle data, for vehicle owners and repair shops. The Auto Care Association is doing a great job supporting legislation to provide access to the aftermarket. We are partnering with other industry leaders and supporters to provide additional access to the data. An important part of our customer-experience roadmap is building a more robust product assortment closer to the customer to improve availability and reduce order-to-delivery times. Our customers expect shorter times to drive higher bay turnover. To support this initiative, we’re building out a digital delivery system that includes real-time access to delivery times from our stores, branches, hubs and DC network. This will provide our team members and customers delivery-time estimates during the order process so they can make an informed decision. CM: How are you feeling about the business environment for the automotive aftermarket in 2019? BC: The fundamentals look really strong. We’re looking forward to a terrific 2019, as we experienced in 2018. The industry will continue to grow and provide opportunities. Low unemployment, miles driven, low fuel prices, the average age of vehicles, improved “sweet spot” – all of those factors indicate a very positive, robust industry in 2019. We love the momentum we’ve experienced throughout 2018, and we see that momentum carrying through 2019. CM: What are some of the macroeconomic issues that could have an impact on your business in 2019? BC: Obviously, we’ll be watching the tariffs carefully. For the most part, I think the prior [round of tariffs]wasn’t an issue. The industry was growing and well-positioned to pass on the price adjustments. As I mentioned earlier, one of the greatest industry challenges is the technician shortage. We continue to focus a lot of time and energy into the CTI and the WTI. We’ve partnered with NASTF on developing a technician career path. We’ll continue to work with our strategic partners to develop that career path, to attract more high school students into this industry. We’re committed to helping the industry address this critical challenge. We have a feasibility study in progress to assess building an Automotive Institute of Science and Technology. More to come relating to this important initiative. Source: https://www.counterman.com/advance-professional-evp-bob-cushing-digital-roadmap-will-be-continue-to-be-major-focus-in-2019/
-
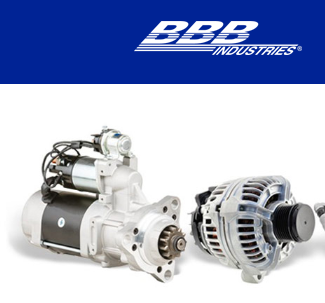
BBB Industries announced it has acquired the equity interests of the Remy North American rotating electric business, consisting of World Wide Automotive and Remy Mexico Holdings, more commonly known as Remy Power Products. “Remy Power Products brings a century of OE experience to the automotive aftermarket, delivering industry-leading starter and alternator coverage for domestic and import passenger vehicles,” BBB Industries said in a news release. “Automotive service professionals value and trust the Remy brand for benchmark-quality rotating electrics, responsive support and world-class technical training.” The transaction encompasses the entirety of Remy’s North American rotating electric business, BBB Industries noted. “Remy’s remanufacturing expertise and market understanding along with its proven ability to provide high-quality products is a natural complement to BBB,” BBB Industries CEO Duncan Gillis said. “The Remy brand has a rich history, and I am excited about the opportunity to bring this added value to our existing and new customer relationships.” Dave Overbeeke, CEO of Remy Holdings, added: “With continuity for our customers a key transaction priority, we are confident that BBB’s excellent aftermarket reputation and scale in rotating electrics will enhance the customers’ overall experience.” Founded in 1987, BBB Industries produces remanufactured starters, alternators, hydraulic and air disc-brake calipers, power-steering products and turbochargers for OEM and aftermarket applications. Source: https://www.counterman.com/bbb-industries-acquires-remy-power-products-north-american-rotating-electric-business/
-
For anyone that hasn't checked out CARid yet, you may find this site has a pretty good offering of auto parts and aligns in the space that RockAuto does in terms of pricing and market strategy. CARid partners with distributors and drop ships orders to it's customers. Same as what Rock Auto does. It's worth checking out as we found somethings were cheaper on CARiD and some on RockAuto, so check both.
-
Auto Anything coupon codes for 10% off, $20 off, $30 off, and $80 off.
-
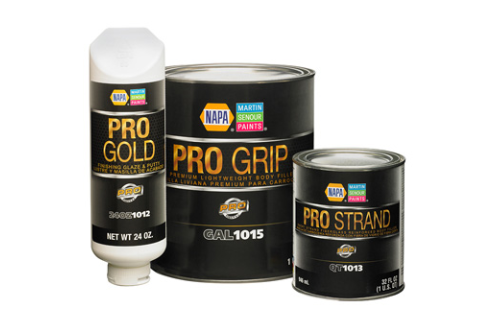
Martin Senour has introduced PRO Filler body filler, a premium line of lightweight filler, fiberglass-reinforced filler and putty. The professional-grade product offering provides reliable, high-caliber performance in any repair, according to the company. “Body shops seeking a straightforward, cost-effective solution to auto body repair look to the PRO Filler line for a quality product that will promote shop productivity,” the company said in a news release. “With professional-grade adhesion, elimination of micro-pinholes and industry-leading sanding properties, PRO Filler is a versatile system fit for any repair job. The complete PRO Filler product line is available exclusively at NAPA Auto Parts stores: PRO Lite lightweight body filler PRO Grip premium lightweight body filler PRO Strand short-strand fiberglass-reinforced PRO Strand XL long-strand fiberglass-reinforced PRO Gold finishing glaze & putty PRO Spot 1k air-dry putty “The complete PRO Filler line allows for seamless repair,” said Nick Dowling, product manager, Martin Senour. “It’s an asset in any job that requires a product with strong adhesion and smooth application.” For more information regarding Martin Senour paint products and training opportunities, visit www.martinsenour-autopaint.com/ or call 800-526-6704.
-
If you’re selling or distributing aftermarket parts, you’ve probably been hearing the term “omnichannel” more and more lately. The goal of omnichannel sales and marketing is to create a seamless, integrated experience for customers as they research and buy products via all of the platforms and devices they use to interact with your business. Those platforms can include brick-and-mortar stores, websites – accessed via desktop computers or mobile devices – the telephone and social media. “With omnichannel, it’s all about making the customer’s life as easy as possible,” explains Aaron Agius in a HubSpot article. While it might seem like just another buzzword, creating a seamless omnichannel experience is very much on the radar of AutoZone and other parts retailers. “We continue to invest in our strategy to enhance the customer’s shopping experience in an omnichannel world,” AutoZone Chairman and CEO Bill Rhodes said during the company’s Dec. 4 conference call. “We have initiatives in place to improve our in-store systems and websites – AutoZone.com, AutoZonePro, mobile and ALLDATA. In fact, we are investing more capital than ever before this fiscal year in improving these systems.” In September, AutoZone announced it will offer next-day delivery for online orders in most U.S. markets. The program “allows customers in 85 percent of U.S. markets to order as late as 10 p.m. and receive their products at their home the very next day,” Rhodes explained. The company made approximately 100,000 SKUs available for next-day delivery, according to Rhodes, and expanded the program to more than 95 markets during its fiscal 2019 first quarter, which ended Nov. 17. “We are also working diligently to further enhance our digital capabilities with our commercial customers to ensure that they have a great, seamless, intuitive no-hassle way to interact with us digitally,” Rhodes added. Overall, AutoZone has seen growth in its website traffic, and more customers buying online – whether they specify the ship-to-home or pick-up-in-store option. But brick-and-mortar stores continue to be the primary touchpoint for its customers, Rhodes noted. “ … We continue to see customers primarily doing lots of research online and then coming into the store in order to receive trustworthy advice, Fix Finder, Loan-A-Tool and a host of other services that simply cannot be duplicated online prior to making the sale,” he said. Still, AutoZone will be investing heavily in its online channels. “We will continue to make our omnichannel selling efforts a key focus for 2019,” Rhodes said. “ … While our online sales are small – substantially less than 5 percent of our total sales – the omnichannel experience is very important for the customer experience.” Source: https://www.counterman.com/autozone-in-an-omnichannel-world-most-customers-still-come-to-store-for-trustworthy-advice/
-
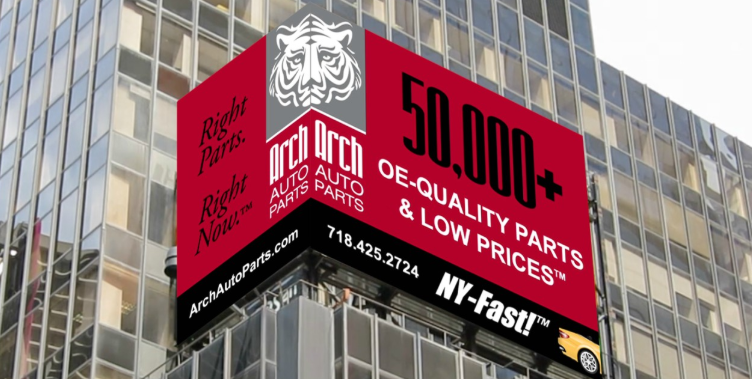
HOLLIS, N.Y., Dec. 18, 2018 /PRNewswire-PRWeb/ -- Arch Auto Parts, a leading aftermarket retail and wholesale auto parts supplier in Brooklyn, Queens, and Long Island, NY is celebrating its 40th anniversary with a video billboard in Times Square. Throughout the holidays, including the famous New Year's Eve celebration, millions of New Yorkers seeing the ad are discovering they have a local alternative to the big chain stores, where they can find higher quality car parts for domestic and import cars, at lower prices, from the best automotive brands. Locally-owned Arch Auto Parts, with neighborhood stores in Brooklyn, Queens, and Long Island, provides '50,000+ OE-quality parts and low prices. NY-Fast!™' The ad spotlights OE-quality parts Arch stocks from Bosch and DENSO, two of the most important original equipment manufacturers (OEM) for the world's automotive industry. "When your friend turns 40, you throw them a big party. When your business turns 40, you get a billboard in Times Square and celebrate at one of the world's biggest parties," laughs Chris Bodh, Owner and CEO. The Arch Auto Parts ad is running November 15, 2018, through January 31, 2019, at 1500 Broadway and 43rd St., in the heart of the Times Square bowtie area, above the pedestrian-friendly Times Square Plaza. This is where the ball drops on New Year's Eve, the concerts are staged, and a worldwide audience estimated at over a billion people watch on television as they ring in the New Year. Last year on New Year's Eve alone, approximately 2 million people were packed into Times Square, and most of them were there all day to guarantee a spot before the festivities began. Even on typical days, hundreds of thousands of people pass through Times Square daily, and the billboards are one of the main attractions. This year, these commuters, holiday shoppers and New Year's Eve revelers will see Arch Auto Parts on one of the biggest platforms in the world. The billboard wraps around a high corner building on Broadway, significantly increasing the visibility of this winter-themed ad. The left side of the billboard animates Arch Auto Parts' "Right parts, Right now®" service promise, with a car that stutter-stops in front of an Arch Auto Parts store. Exactly the right parts fly out the door, self-install under the hood, and the car zooms off, "NY-Fast!™" The right side of the billboard features Bosch and DENSO, two of Arch Auto Parts' top suppliers. The first video is for Bosch ICON™ windshield wiper blades, an excellent wiper for improving visibility in winter sleet and snow. Next, the DENSO ad for spark plugs encourages shivering viewers, "If the weather outside is frightful, let's go find your happy place." "With DENSO, you're ready." as a classic cruiser drives down a sunny beach. These ad components all work together to communicate that this winter, Arch Auto Parts is where to find OE-quality auto parts from top name brands. In NYC, there is a constant flow of traffic between the boroughs. This is especially true on weekdays, with the population of Manhattan nearly doubling from 1.6 million to 3.1 million people on a typical workday. Many of these commuters come in from Brooklyn, Queens, and Nassau County where Arch Auto Parts has a large presence. These areas also have a high concentration of repair shops, so naturally, it is a destination for buying auto parts. Arch Auto Parts has been a local favorite with top-rated repair shops for high-quality parts and low prices for four decades. More recently, Arch has been increasing awareness among retail shoppers. So far in 2018, Arch Auto Parts has received over 440 reviews on Google averaging 4.4 stars out of five. "We know from our experience and data that once they're in the door, we will likely have a long-term customer. This billboard is helping get the word out that Arch Auto Parts has the name brand, OE-quality parts, fast service and low prices shoppers want," notes Lucy Henner, VP Marketing, Arch Auto Parts. About Arch Auto Parts Founded in 1979, Arch Auto Parts' thirteen locally owned and operated stores in Brooklyn, Queens and Long Island, NY, serve professional service and repair shops, dealers, and truck and commercial fleets, as well as DIY mechanics and other retail customers. Arch Auto Parts delivers unsurpassed customer service and discount prices on a wide selection of OE-quality auto parts and supplies from AC Delco, Advics, Aisin, Akebono, Anchor, AP Exhaust, Arc, Arnott, Bando, Beck/Arnley, Bosch, Carter, Centric, Chemours, Continental, CRP, Delphi, Denso, Dorman, East Penn/Federated, FCS, Fel-Pro, Four Seasons, GMB, Grote, Hastings, Hella, Hengst, K&N, KYB, MAS, Maval, Moog, Motorcraft, MPA, National, NGK, OSC, Pagid, Pentosin, Premium Guard, Prenco, Standard Motor Products, Stant, Sylvania, TrakMotive, Trico, TRW, TYC-Genera, URO Parts, US Motor Works, Valeo, VDO, Wagner, Walker and other trusted brands. Arch Auto Parts stocks more than 50,000 OE-quality car and truck parts for domestic and foreign vehicles, including parts from original equipment manufacturers (OEMs) and hard-to-find parts not available at national chains. Parts stocked include brake pads, drums and rotors; wheel hubs and bearings; motor mounts, chassis and control arms; steering and suspension parts; cabin filters, oil filters, fuel and emission parts; sensors and switches; belts, hoses and water pumps; ignition, batteries, starters, alternators and distributors; heating and air conditioning; wiper blades and bulbs; and hard-to-find car parts such as window regulators and wiper motors. Arch Auto Parts is open seven days a week with experienced counter staff dedicated to helping New Yorkcustomers find the exact-fit parts they need in-store. Most Arch Auto Parts orders are ready for in-store pick-up in 30 minutes or less. For more information, visit us at ArchAutoParts.com or call 718-425-ARCH (718-425-2724). Source: https://www.benzinga.com/pressreleases/18/12/r12863982/arch-auto-parts-celebrates-40th-anniversary-with-billboard-in-times-sq https://www.archautoparts.com/arch-auto-parts-times-square-new-video-billboard-ad-2/
-
RALEIGH — After years of becoming more Raleigh centric, Advance Auto Parts has officially made the City of Oaks its corporate headquarters, but only after receiving a $12 million incentive package from state and local governments. On Wednesday morning, the state Economic Investment Committee approved the incentives for the publicly-traded auto parts retailer. Company officials then joined Gov. Roy Cooper at the old N.C. Capitol building to make the announcement shortly before 10 a.m. In addition to moving its corporate headquarters from Roanoke, Va., to Raleigh, the company plans to invest $5.5 million here and create 435 new jobs over five years. The average annual wage for those jobs will be $106,000. The average annual wage in Wake County is $56,245. Those 435 new jobs are going to be heavily focused on technology, with the company ramping up its digital marketing and software staffs to better compete for online shoppers. “About 70 percent of the purchases in our category start on a mobile device. So, whether or not they are walking through the swinging doors or ordering online, we need to win in that space,” Tom Greco, Advance Auto’s CEO, said in an interview Wednesday after the announcement. “Talent availability is absolutely the No. 1 driver” of our decision, Greco added. “You have to have access to software developers, software engineers, dev ops, all of those areas are important. We have a great talent pool in Raleigh to do that work.” The 435 jobs will be based at the company’s corporate campus on Millbrook Road and in the Duke Energy tower in downtown Raleigh, where its digital marketing team is located. The company must meet hiring and investment goals to receive any incentive funds. This is the incentives breakdown: $9.4 million Job Development Grant from the state; $500,000 from the City of Raleigh, $88,000 from Wake County and $370,00 from Capital Area Workforce Development. Because Wake County is considered a tier-3 county, the Department of Commerce will pay up to $3.1 million into the state’s Industrial Development Fund’s Utility Account. The Utility Account helps rural counties fund infrastructure projects. Advance Auto Parts officials said the company was looking at both Henrico, Va., and India for its relocation and expansion. “It was a competitive process and Virginia participated and that was a factor” in North Carolina needing to offer incentives, Greco said. However, the company has steadily become more Raleigh focused, expanding functions and moving employees here, since 2014, when it acquired its Raleigh-based competitor General Parts International for $2 billion. Advance still has around 600 employees in Roanoke — mainly in customer support — and there will be no expected cuts there. In 2017, Greco, and a majority of Advance Auto’s leadership team relocated to Raleigh. The executive team all received thousands of dollars in relocation benefits from Advance Auto, according to documents filed with the Securities and Exchange Commission. This is the second time the state has given Advance Auto Parts an incentives package. In 2014, the company was awarded more than $17 million shortly after it acquired General Parts. At that time, Advance Auto said it would create 600 new jobs in North Carolina. The company is still responsible for meeting hiring and investment requirements from the 2014 agreement. A majority of those 600 jobs, however, weren’t exactly new. Rather they were workers that were already employed by General Parts, The News & Observer reported at the time. Governor Cooper said in an interview that incentives were necessary to keep Advance in Raleigh. Incentives were “necessary to make it happen,” Cooper added. “Look they had other choices … we feel good about the package we presented and feel positive that they made this choice.” Attracting headquarter projects to North Carolina has become an increasing priority for the state’s economic development arm. The state has narrowly missed out on several projects in recent years. Currently, the state legislature is considering a bill that would more than double the amount of incentives that the state can offer to companies. Though, Advance’s deal was done under the current incentive framework and will not be eligible for any increases the state might pass. Cooper said he supported increasing the amount of incentives the state can offer. “There are other efforts out there that we believe it will affect,” Cooper said. “We are looking forward to attracting more companies and maybe even more corporate headquarters to North Carolina.” When asked whether Apple was still looking at the state, Cooper declined to comment. “I can’t talk about economic development projects, but we are going to continue to work to attract all kinds of companies and particularly technology companies that are on the west coast,” he said. “We are a center for technology and for bio technology in North Carolina and those kinds of companies are ripe” for working in North Carolina. Source: https://www.courier-tribune.com/news/20181130/advance-auto-parts-receives-12m-to-relocate-corporate-hq-to-raleigh
-
Here's one market Amazon can't easily crack: Car parts
APF posted a topic in Amazon Auto Parts Forum
New York (CNN Business) - Amazon is gunning to sell more car parts. But it will run up against fierce resistance from a small army of firmly established companies already doing just that. One of them is Advance Auto Parts. Advance has designed a vast logistics network to deliver parts to auto mechanics and do-it-yourself car owners right away. "Independent garages have got to get that car fixed as fast as possible, or you're not going to them again," said Charlie O'Shea, lead retail analyst at Moody's. "They measure delivery times in hours and minutes, not days." Speed isn't the only factor separating Advance (AAP), AutoZone (AZO) and O'Reilly (ORLY) from Amazon (AMZN). These companies have sharpened their focus on service, helping guide customers through repairs and the technical auto parts market. Wall Street believes in the companies' long-term durability: Advance and O'Reilly's stocks have outpaced Amazon's this year. Amazon's moves into car parts But Amazon looms. The company started the Amazon Automotive store in 2006 and has been adding services ever since. "Amazon's auto-part retail business is becoming too big to ignore," MoffettNathanson analyst Greg Melich said in a report last month. It has recently accelerated efforts to sell car tires, batteries and accessories. The company struck a partnership with Sears that allows customers to buy Sears tires from Amazon and get them shipped to Sears Auto Centers around the country for installation. Amazon expanded a tie-up with Pep Boys earlier this month for a similar service at 1,000 of Pep Boys' stores. Amazon also has an agreement with Monro Muffler Brake. "We're pleased with the customer response to our Ship-To-Store offering," Amazon's director of automotive Adam Goetsch told CNN Business. Amazon is adding more brands to its website and trying to get customers familiar with buying parts online. During the Black Friday and Cyber Monday stretch Amazon promoted car battery jump starters and wiper blades for the first time. They're 30% off until December 1. Goetsch said the most popular automotive products among Amazon customers this holiday season included jump starters, wiper blades, cleanings kits, and RV accessories. That makes sense because more DIY customers are shopping online for components and accessories that they don't immediately need to repair their cars. Amazon may want to sell more hard parts, like engines, crankshafts and flywheels. Online sales of components like brakes and fuel systems grew 29% in the past year, according to data from NPD Group and Rakuten Intelligence. "These categories have historically been challenging for the typical consumer to shop online for, but this task is getting easier," NPD analyst Nathan Shipley said in a report. But those hard parts sales remain in Advance's wheelhouse. Lightning-fast delivery Advance may seem like an unlikely company to thrive in the digital era, but the old-school car shop has taken steps to prepare for Amazon's encroachment. Advance has close to 6,400 stores — some of them under banners like Carquest and Worldpac — and 54 distribution centers that put them close enough to its customers to make same-day or next-day delivery a snap. It has also built larger "hub" stores in higher-traffic markets that keep more items in stock. The company makes around 58% of its sales to technicians at garages, service stations and auto dealers, who often don't know what parts they'll need until the day begins. Rapid delivery is critical. Advance Auto Parts has bult out a rapid logistics network to meet customers' parts needs. "There's a huge need for inventory availability and quick delivery out there," said Seth Basham, who covers the industry at Wedbush Securities. Although Amazon is looking to find retail partners, it would need to acquire an auto parts seller with similar distribution capabilities to be able to match Advance's same-day network. "You're not going to use Whole Foods to deliver auto parts to a garage. A brick-and-mortar presence is critical here," O'Shea said. Auto parts experts Advance offers expert solutions in a complex auto parts market, something Amazon can't provide. Staffers consult with customers to find the right products, and Advance offers training classes and posts on YouTube to help DIYers with repair jobs. Amazon is known for its variety, but Advance sells a wider range of national brands, private-labels, and original equipment from manufacturers. "The garage owners love this model," O'Shea said. "You need somebody that has deep knowledge and knows the parts catalog backwards and forwards." Adding to its advantage, Advance has close relationships with auto parts suppliers. Many manufacturers are wary of selling through Amazon because they worry that it would help the company learn the business and one day take it over. Analysts say carrying hundreds of thousands of different parts is ill-suited to a company without deep experience in the field. Amazon might have trouble stocking and selling bulky physical components and batteries — new engines, brakes, and exhausts — which are specific to a car's make and model. On the other hand, selling car parts and batteries make up 65% of Advance's total sales. But the company will need to keep adjusting its prices to keep up with Amazon's relentless focus on providing value. A MoffettNathanson analysis found that Amazon's prices were 29% lower than traditional competitors on 30 top-selling items. Advance risks losing its edge with such a wide pricing gap. A new Walmart deal But Advance should get a lift from its newest partner: Walmart (WMT). Advance struck a deal last month with the world's largest retailer for a specialty store page on Walmart's website. It believes the tie-up will allow it to increase its visibility online and reach more DIYers. Advance may see selling through Walmart as safer ground than Amazon. "I don't know that Walmart wants to start manufacturing auto parts," O'Shea said. The Walmart partnership is key because it will bring Advance into Walmart's 2,500 auto care centers around the country. Leveraging Walmart's store footprint will help Advance expand same-day delivery as competition intensifies and Amazon finds ways to speed up parts delivery. "The biggest challenge Advance faces is still the online channel. That's the concern investors have out there," Basham said. "How quickly do solutions by online players develop to become more material threats?" Source: https://www.cnn.com/2018/11/29/business/advance-auto-parts-oreilly-autozone/index.html -
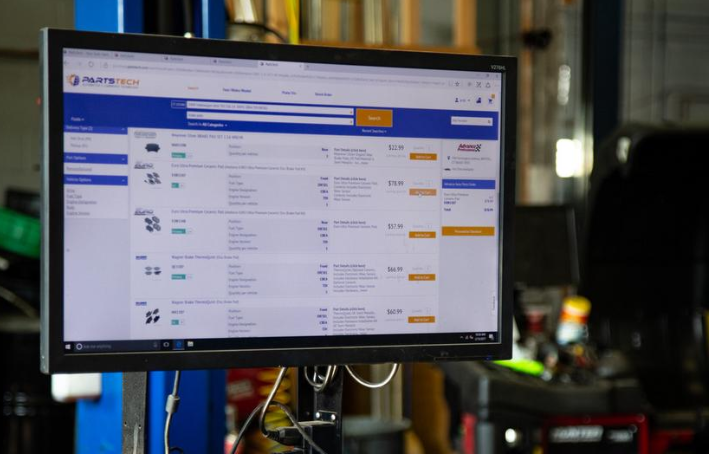
A six-year old startup has gotten the attention of a 93-year old industry stalwart. PartTech has announced that it is partnering with NAPA Auto Parts, a subsidiary of Atlanta-based Genuine Parts Company (NYSE: GPC), to open e-commerce sales distribution channels to an industry that is heavily reliant on retail location, aftermarket shops, and dealership sales. Led by co-founder and Chief Marketing Officer Erik St. Pierre, PartsTech is taking head-on the complexity of selling auto parts and making waves in the $73 billion-per-year wholesale auto parts industry. While most anything can be purchased online these days, online automotive parts sales have been only started gaining traction in recent years. St. Pierre attributes that to the complexity of the business. “Unlike most product categories that are relatively simple to describe and display online, auto parts are unique due to their complex relationships to particular vehicles, and often to other parts," St. Pierre said. "For example, a brake rotor may only fit your Jetta if the car had been manufactured in a certain date range and came with the sport package. Auto parts sales are esoteric enough that even online-retail giants have struggled, and continue to struggle, with automotive parts." According to PartsTech, 75 percent of commercial parts orders are still placed over the phone. PartsTech allows buyers to log in and search for needed auto parts and find which stores closest to them have the part in stock and, if possible, can deliver it to their location. Using PartsTech’s search functionality speeds up the process because one search replaces many phone calls. PartsTech isn’t the fronting page most consumers will see when they access NAPA’s online shopping site. Instead, PartsTech works like a site that aggregates travel deals, but for auto parts, connecting repair shops and parts suppliers to the parts they need in their local area. “In the same way that Expedia acts as an aggregation platform that brings together providers like Delta or American Airlines so that you don't have to waste time visiting 10 airline websites to book a trip, we help aggregate over 20,000 parts stores across the U.S. so that repair shops can search once, and find the parts they need to repair your car,” explained St. Pierre. There are 160,000 repair shops in the U.S. Since PartsTech's 2012 founding they have added 55 percent of those stores to their parts catalogue. Their technology also has integrated their parts ordered system within 25 shop management systems, allowing for parts to be purchased using existing work orders. PartsTech’s data shows that users who are integrated via SMS order 64 percent more parts than those working only with PartsTech.com. With its NAPA Auto Parts and Advance Auto Parts partnership among others, PartsTech aims to help vehicle owners get back out on the road sooner. “We originally built the PartsTech system for professional repair shops, but professionals and enthusiasts share a common pain point: not having a central source to track a particular car part, which is often identified while the car is torn apart," St. Pierre said. "To get cars back on the road, time is of the essence." PartsTech estimates that most parts stores deliver parts to their commercial customers in 30 to 45 minutes. As generational turnover of auto repair shops continues to evolve the industry, PartsTech sees room for expansion. Additional partners will be announced in 2019. Source: https://www.bizjournals.com/atlanta/news/2018/12/13/automotive-minute-napa-auto-parts-partners-with.html
-
Dorman Products - Service Dealer Guides
APF replied to Teddy's topic in Auto Parts Brands and Manufacturers
Here's 2018 Spring Dorman Dealer Guide Volume 1 dealer Guide PDF Download: 2018v1-dorman.pdf